Previous Topic

Next Topic

Book Contents

Book Index

Server details page

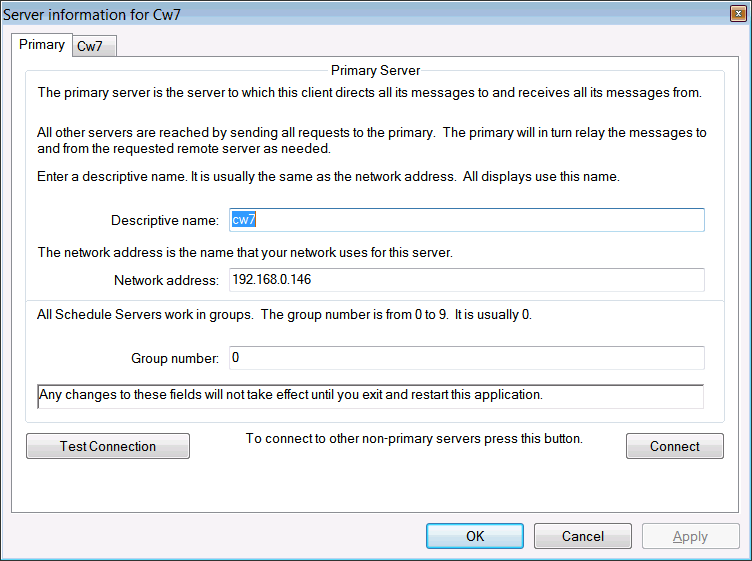
There is a large array of information available for diagnosing and benchmarking performance of the EnterpriseSCHEDULE server. This includes several pages of available data as well as a live server activity monitor that tracks CPU usage and dispatches per second in a graphical display. To view the server information for the selected server:

  1. Select Server... from the main File menu or right click on the server in the Job Explorer and select Properties.
  2. Select the tab corresponding to the server descriptive name.

In This Section

General server info

Counts

Server Parameters

Network Info

Server Profile

See Also

Working with SCHEDULE servers

Changing the primary server

Connecting to a server for the first time

Adding additional servers to the EnterpriseSCHEDULE Explorer

Servers on remote nodes