![]()
![]()
![]()
![]()
|
|
|
|
|
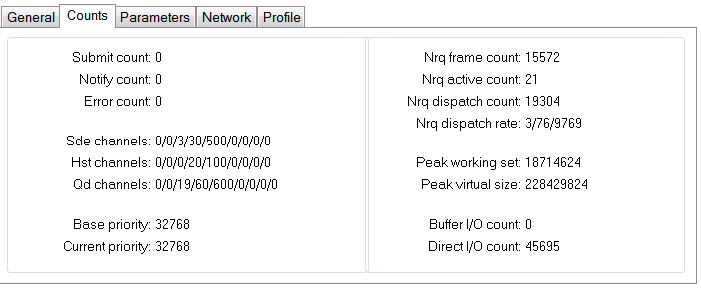
To view Server Counts, click on the Counts tab.
Field |
Description |
Submit count |
Number of jobs submitted since server start |
Notify count |
Number of notifications since server start |
Error count |
Number of errors since server start |
Channels SDE
|
Number of channels to control file. Entries are: In use channels/Open channels which may or may not be in use/Peak channels open/Parameter file maximum channels/Absolute maximum channels/Channel request backlog/Peak backlog |
Channels HST
|
Number of channels to history file. Entries are: In use channels/Open channels which may or may not be in use/Peak channels open/Parameter file maximum channels/Absolute maximum channels/Channel request backlog/Peak backlog |
QD Channels
|
Number of channels to queue file. Entries are: In use channels/Open channels which may or may not be in use/Peak channels open/Parameter file maximum channels/Absolute maximum channels/Channel request backlog/Peak backlog |
Current priority |
Current priority of SCHEDULE server |
Base priority |
Starting priority level of server |
NRQ frame count |
Server execution sequence count |
NRQ active count |
Available processing request packets |
NRQ dispatch count |
Number of processing steps performed |
NRQ dispatch rate |
Number in last second interval/Average NRQs/Peak NRQs |
Peak working set |
Memory used by peak working set |
Peak virtual size |
Virtual memory of peak set |
Buffer I/O count |
CPU time devoted to SCHEDULE activity |
Direct I/O count |
Elapsed time devoted to SCHEDULE activity |