| Previous | Contents |
In the previous section we looked at the job monitor and how it can be used to monitor the queue activity of a job in the job group window. This will briefly describe how the MOTIF Editor/Monitor let's you see how your jobs are doing once they enter the execution queue.
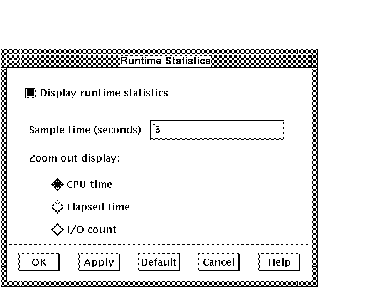
The runtime statistics displays a bar graph indicating the progress of the job. The three statistics that are displayed are:
The bar graphs represent a ratio of the actual time of the current execution divided by the measured values that are designated in the job resource controls as described in Section 2.6.1.1.6.
Figure 1-8 shows an example of the runtime statistics display from a typical job run.
Figure 1-8 Runtime statistics display

In addition to providing a graphic view of the runtime statistics within the job group window, the CPU, elapsed and I/O time may be viewed numerically as the job executes. Figure 1-9 displays the runtime statistics monitor window. The left column shows the actual CPU time, elapsed time and I/O time values next to the right column which shows the measured values for these statistics. When the job is completed, the monitor window disappears from the screen.
Figure 1-9 Runtime statistics monitor

1.2.5.3 Interdependency lines
Interdependency lines are used to graphically display the
interdependencies between jobs. The lines are drawn between jobs that
either have a initiate or prerequisite relationship. The connecting
lines have specific visual properties depending on the type of
dependency and the nature of the success or failure of the dependency.
Initiate lines show the connection between an initiate and the job that is activated by the initiate. The initiate line is a line with an arrow at the end. The arrow points to the job that is initiated by the connected job. An initiate line is shown in Figure 1-10.
Figure 1-10 Initiate line example

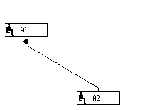
Prerequisite lines show the connection between a job and the prerequisite(s) that must be completed before the job will be submitted. The prerequisite line is a line with a dot at one end. The dot is closest to the prerequisite job. A prerequisite line is shown in Figure 1-11.
Figure 1-11 Prerequisite line example

The width, color and continuity of the dependency lines may be configured according to the options described in Section 2.10.7. This makes it possible to differentiate between various types of dependency conditions. For instance, if you want a line to represent an initiate that submits only after the previous job is successful, you could make the line dotted. If you want to differentiate lines that connect an initiate based on the failure of the previous job, the line could be designated as a wide solid line.
| Previous | Next | Contents |