![]()
![]()
![]()
![]()
|
|
|
|
|
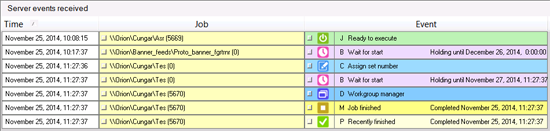
Clicking on a job in the event column of the Job Monitor will open the Event monitor pop-up window for that job. The Event monitor pop-up provides a dynamic view into the events of a particular job as it progresses through the queues. The three columns in the Event monitor window are described in the table below.
Column |
Description |
Time |
The time stamp is the time that the job entered the selected queue. |
Job |
The job name and location as well as the set id in parenthesis. Click on this button to open the job properties for this job. |
Event |
The icon queue state and current status of the job. Click on this button to open the Click on this to open the State details for the current event. |
As events take place, they are added to the bottom of the Event monitor list. The list will grow until the time limit set in the Monitor options is reached. As the limit is reached, events will be removed from the list on a First In, First Out basis.