![]()
![]()
![]()
![]()
|
|
|
|
|
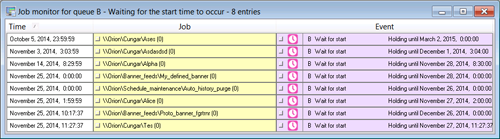
The job monitor window contains four interactive buttons that bring up detailed information about the corresponding jobs in the queue list. These are:
Button |
Description |
Click on a job in the log file column to open the Log File for that job. |
|
Job Properties |
Click on a job in the job column to open the Job Properties page for that job. |
Click on an event in the state column to open the Event monitor pop-up window which displays a history of all recent events for the selected job. |
|
Displays Event State Details and Run Time statistics in a dynamic graphical display. |