![]()
![]()
![]()
![]()
|
|
|
|
|
When a job enters the L queue, it executes the assigned batch commands. At this point, EnterpriseSCHEDULE begins to monitor Run Statistics and displays them as live graphical data in the progress window.
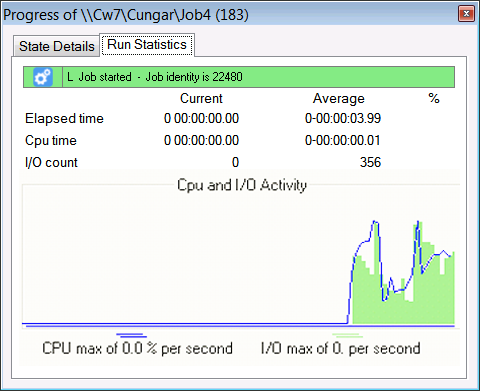
This information can be used to determine the resource usage of the job. The three statistics that are monitored are:
Elapse time - The number of seconds of elapsed time used by the job.
CPU time - The number of seconds of CPU time used by the job.
I/O count - The number of I/Os (buffer I/O plus direct I/O) that the job has used.
The graph represents a ratio of the actual time of the current execution divided by the measured values that are designated in the job resource controls. The blue line represents the CPU time and the green filled area represents the I/O count.
In addition to providing a graphic view of the runtime statistics within the job group window, the CPU, elapsed and I/O time may be viewed numerically as the job executes. The left column shows the actual CPU time, elapsed time and I/O time values next to the right column which shows the average measured values for these statistics. The last column shows the percentage of current levels divided by the average measured value. This tells you how the job is doing compared to it's measured values.
When the job moves to it's next state, the monitor Run Statistics will no longer be displayed. The bar in the top of the window will show the current queue state.